A Virtual World of Visualization
Under the hood and through the furnace.
Those are two places where industry has gained cost-saving advances from spinoffs of NASA aerospace computer technology. That is the way that M. Gene Konopik sees it as President, Federal Systems Group of Sterling Software, Incorporated in McLean, Virginia. Sterling Software has had a 25-year history with NASA.
Advanced three-dimensional (3-D) interactive graphics were pioneered at the Ames Research Center (ARC). These same tools have been adapted and adopted in ways that now help advance automotive virtual reality models, heat flow in furnaces, and air pollution.
Starting in the early 1980s, ARC made significant investments in pioneering research and development for scientific visualization. ARC developed 3-D graphical data formats and basic graphics codes for displaying computational fluid dynamics (CFD) results.
Sterling Software began assisting NASA by building the first workstation software packages for 3-D scientific animation. While these early packages were originally built for aerospace CFD graphics, prospects began emerging for many other applications in visualizing similar 3-D grid-oriented data.
In 1990, Sterling Software developed a toolkit for ARC on contract. As a workstation-based modular analysis and visualization tool, animated grids and grid-oriented data can be derived. While constructed in modules, each module of the tool operates as an independent process. They are under control of a central process that maintains the toolkit's data in shared memory. A few of the current modules include: interactive surfaces, vectors and contours; generation of isosurfaces and arbitrary cutting planes; unstructured data analysis; grid quality, resolution, and geometry inspection; and computation of scalar and vector CFD functions and custom algorithms.
Sterling Software's visualization toolkit is most widely used for reviewing fluid flow and similar types of grid-oriented 3-D data. The Space Shuttle, jet engine turbine internal flows, vertical short-takeoff-and-landing ground effect research, and the vortex dynamics of whirling helicopter blades—these are examples of technologies where the visualization software has proven of great merit.
On a non-exclusive basis, Sterling has created special-purpose versions of its software toolkit. Designed with industry and non-NASA customers in mind, the visualization software can now be run on a wider set of workstations. Ford Motor Company, for example, has made use of Sterling's toolkit and modules to visualize under-hood and under-body air flow and heat build-up. Sterling engineered a special package of virtual reality-based computer software to help Ford shape interactive virtual work sessions. The automaker is investigating ways engineering and design personnel--either at the same spot or distant locations--can dynamically adjust a mathematical car model, observing the impact of those alterations in real-time or near real-time.
For the U.S. Environmental Protection Agency, Sterling adapted software versions to visualize acid rain deposition and ozone depletion. It is clear that global climate change research is likely to push the frontiers of data visualization technology to a great degree as the globe prepares to enter the 21st century.
Sterling Software's long-standing relationship with Ames Research Center continues in 1998. Recent contracts with NASA support the company's involvement in the NASA Science Internet at ARC. Serving over 25,000 worldwide users engaged in NASA-related science and research, as well as educational collaboration, ARC's NASA Science Internet was created and is maintained by engineers from Sterling Software.
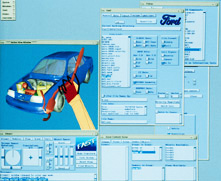
Three-dimensional visualization was stimulated by NASA in the early 1980s for scientific data display purposes.
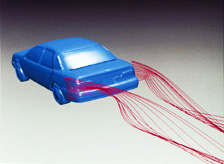
Sterling Software's visualization technology has made a mark on the automobile industry by allowing under-the-hood changes in a virtual reality simulation.
